Frontiers piece reframes EEG in dementia as a stained-glass map
A Frontiers article titled 'Mapping the space of dementia with EEG in stained glass' offers a visualization-led perspective on how scalp EEG recordings can be organized to chart neurodegenerative disease subtypes.
Updated
By Priya Raman
A Frontiers-indexed article titled Mapping the space of dementia with EEG in stained glass introduces a visualization-led perspective on how scalp electroencephalography (EEG) recordings can be organized to characterize neurodegenerative disease. The piece, surfaced through the journal's news feed, presents EEG feature mapping as a way to chart dementia subtypes across frequency, spatial, and temporal dimensions.
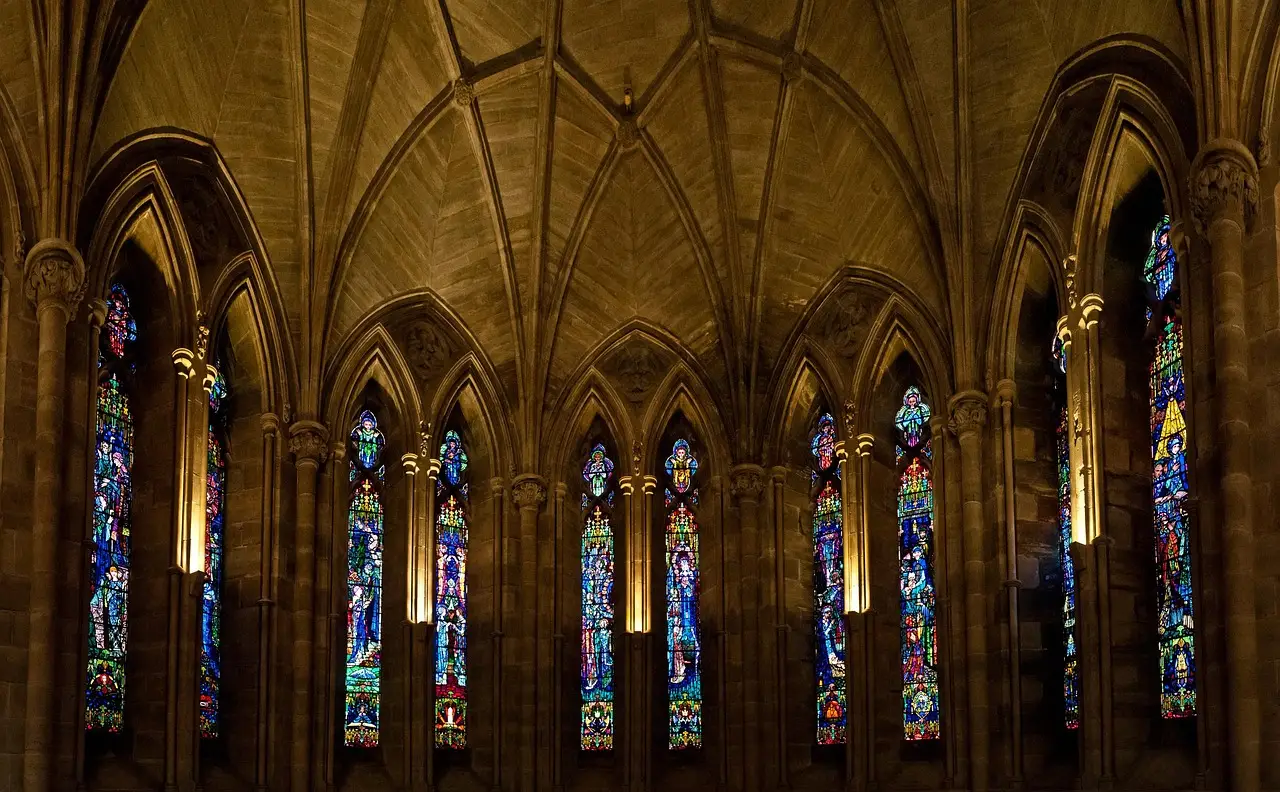
The headline casts EEG data as if viewed through leaded glass, where each colored pane represents a distinct spectral band, topographic region, or connectivity feature extracted from the recording. That metaphor gives a name to a methodological pattern increasingly common in the dementia neurophysiology literature: converting multi-channel time series into compact, interpretable visual signatures that can be compared across patients, visits, and diagnostic categories.
What is the article actually proposing?
The article uses the "stained glass" label to describe a structured visual framework in which EEG features are partitioned into panels, each capturing one analytic lens on the same underlying recording. Such frameworks typically display power spectra, source-localized activity, and functional connectivity side by side, allowing readers to see how an Alzheimer's disease trace differs from a frontotemporal dementia trace at a glance. The piece appears to contribute a conceptual scaffold rather than a new clinical trial, positioning EEG as a mapping tool for heterogeneous dementias.
Why "stained glass" as a metaphor for EEG?
Color-coded spectral and topographic displays have a long history in clinical neurophysiology. Earlier review work in the EEG-dementia field relied on heat maps and butterfly plots to communicate slowing, loss of fast activity, and altered coherence. The "stained glass" framing sharpens that tradition: each pane is a deliberate feature, not a decorative element, and the leaded border marks a defined boundary between features. For clinicians in the reading room, such diagrams translate raw traces into a form that supports pattern recognition across cohorts.
What does this mean for monitoring-unit practice?
If the framework gains traction, EEG reports for cognitive decline referrals may increasingly include a panel-style summary alongside the standard tracing. That would matter for the monitoring unit and the outpatient neurophysiology lab alike, where distinguishing Lewy body dementia, Alzheimer's disease, and vascular contributions from a 20-minute scalp recording remains a daily interpretive challenge. The article is not a regulatory or device claim, and any clinical adoption would require validation against gold-standard biomarker or post-mortem diagnoses.
What is missing from the public record?
The source feed surfaced only the headline and publisher name. The article's authors, submission date, journal section, sample size, and full methodology are not specified in the metadata reviewed here. Readers seeking primary data, cohort details, and statistical claims should consult the original Frontiers article directly once full text access is confirmed.
What comes next?
Whether the "stained glass" model becomes a citation-standard visualization in dementia EEG work depends on whether follow-up studies adopt the framework and on whether peer-reviewed clinical guidelines cite it. The signal so far is conceptual rather than regulatory: a metaphor offered to a research community already moving toward compact, multi-feature EEG signatures for dementia.
Based on
Source: Google News: EEG.
Priya Raman
Show full bio
Market editor covering regulation, policy and their impact on Clinical neurophysiology and EEG interpretation at EEG Signal.